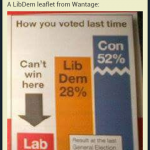
I collect misleading graphs. Here’s an excellent one I saw today.
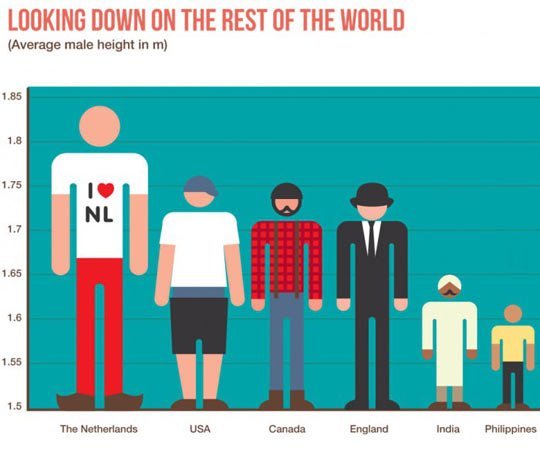
What’s wrong with it? There’s more than the obvious.
How would you regraph it?
Here’s some other weird ones.
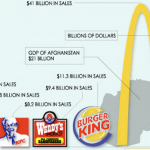
-
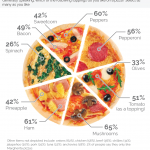
- This one is particularly worthy of discussion
-
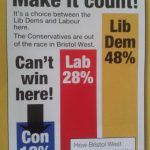
- They’ve tried to make this graph fair. Have they succeeded?
Although maybe it’s wrong to call these graphs
These are ‘infographics’ not graphs. Heathenous maths person… 😉
— TheProvokedPedagogue (@Provokedpedagog) October 9, 2017